You have no items in your shopping cart.
B&G Benchmarking
Similar Terms: benchmark,benchmarked
B&G Benchmarking is the process of testing against multiple items. B&G used wind sensors in various wind tunnel tests to provide incredibly accurate information.
Each sensor is subject to multiple wind tunnel tests:
- 1. Accuracy tests referenced to wind tunnel data -
- 2. wind speed & angle accuracy, at various Heel angles
Observational tests:
- 1. Vane oscillation at all speeds
- 2. Structural vibration or resonance at all speeds
- 3. Mounting sturdiness
A maximum tunnel speed test to test the robustness of each sensor in extreme conditions.
Note: Durability/ reliability life tests are carried out during bump/ shock validation, not wind tunnel testing. This test is used only to identify any obvious weak points (e.g. vane falling off at 70 knots).
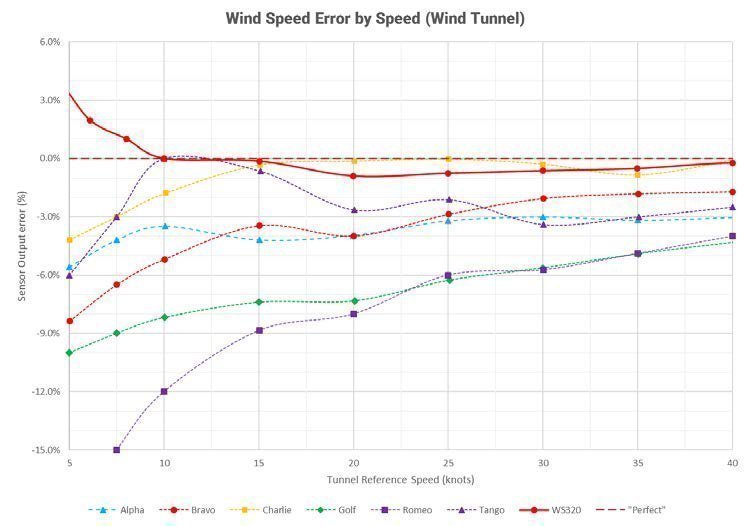
Wind Speed test
This compares wind Tunnel speed with the error in sensor speed output. (See first image on right.) A perfect result is a straight Line along 0%, however is normal to see a larger % error at low wind speeds because (e.g.) a 0.1 >Knot error is a 5% error at 2 knots, but only 1% at 10 knots.
Several competitor products showed significant errors, with two in particular standing out as very poor [Golf and Romeo]. Charlie (see image to right) is an >Ultrasonic sensor and - as expected - performed very well in this upright, controlled test. WS320 shows a very consistent and accurate speed reading.
- Units were calibrated per user instructions if required.
- For the purposes of clarity the Chart covers a wind Range of 5-40 knots, while tests were carried out from 0-80 knots in some cases, competitor products were not profiled below 5 knots, so this data point is excluded.
- No post test calibration as this option is not available to most users.
Wind Angle test
This test compares the sensor wind angle output with a known wind tunnel air-flow angle, using a fixture to mount the sensors in a repeatable manner. A good result is a small error at each angle, shown as a smaller area on the Chart (closer to the centre), with a consistent error being preferred to an erratic one. (See second image on right.)
WS320 exhibits a significantly more accurate wind angle output than all other sensors, up to 10x more accurate than some sensors.
- Units were calibrated per user instructions if required.
- The displayed data was taken at a tunnel speed of 15 knots, chosen as a fairly typical operating wind speed.
- All data was re-aligned post-test to give the smallest maximum error (e.g. if errors were in the Range 0-6 degrees we post-calibrated the offset to give +/-3 degrees)
Heel Angle test
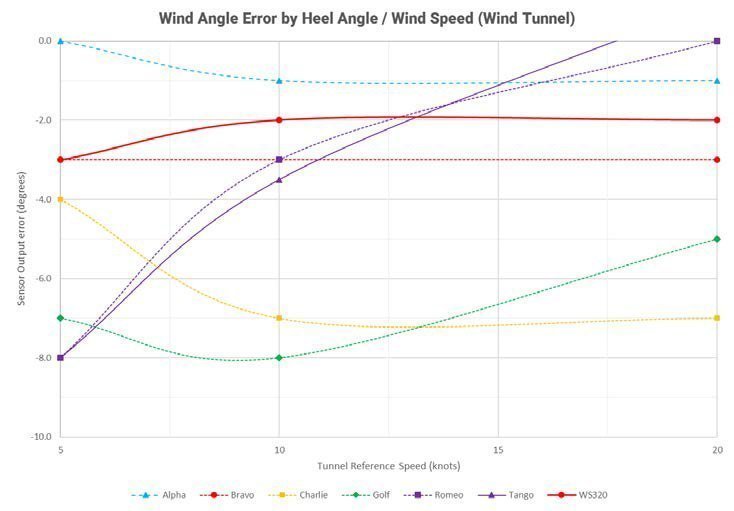
A great test of a “sailing” wind sensor, this test compares the sensor wind angle output with a known wind tunnel air-flow angle while heeled, it is a test used to simulate normal sailing conditions. Errors here are caused by physically changing the angle when rotating the sensor in the air flow, so a good result is a small and consistent error across the wind speed Range (at the same tunnel angle and Heel angle), shown by a reasonably horizontal Line on the Chart. A bad result is a Line with a steep gradient on the Chart. (See third image on right.)
This test highlights general weaknesses in mechanical design. The unusual design of one sensor [Golf] provided very poor performance in this test with high errors. WS320 shows good response to Heel, with a consistent offset that may be corrected in software.
- The displayed data was taken at 30 degrees (rig angle) to the air-flow, to best simulate upwind sailing. Heel angle was varied, selected Chart shows 35 degree Heel angle.
- 30 degree Heel at 5 knots wind speed is not a realistic use-case –used to highlight issues only. Viewing the 10-20 >Knot Range gives a better view of good [Alpha, Bravo, Charlie, WS320] vs. bad [Golf, Romeo, Tango].
Testing Note: For fairness, all benchmarking tests were carried out on a randomly selected sensor from all suppliers: Competitor products were purchased through a consumer Channel, existing B&G sensors were ordered from normal sales stock, new WS320 sensor was a random sample of prototype build 2.
All sensors were calibrated according to manufacturers instructions and data was re-aligned post-test to give the smallest maximum error, despite the fact that this might not be achievable in reality (where calibrations are usually average of Port and Starboard upwind values rather than full 360 degree measurement). Brand names are withheld.
Wind Speed Error by Speed
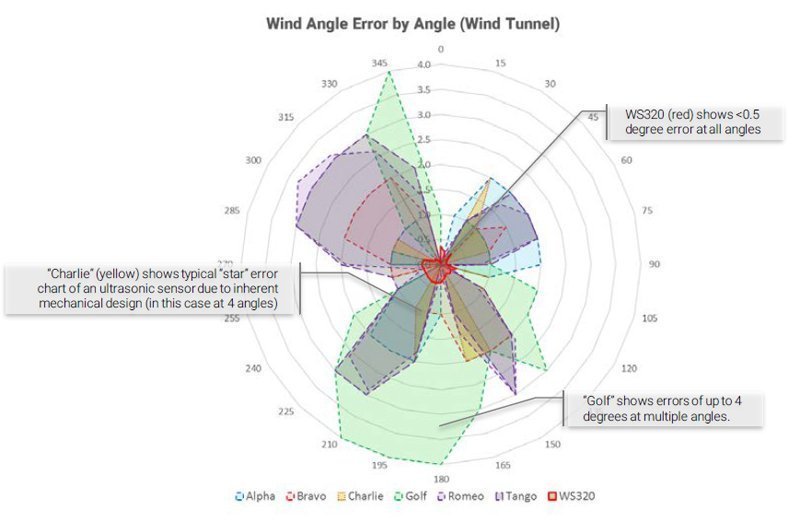
Wind Angle Error by Angle
Related Products
-
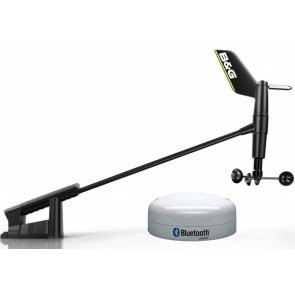
B&G WS320 Wireless Wind Sensor & NMEA2000 Interface Pack
RRP: $1,099.00
NOW: $1,053.00
-
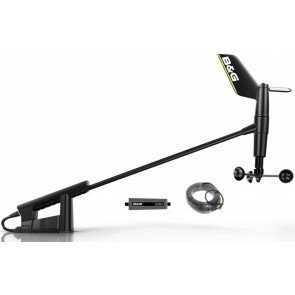
B&G WS310 Wired Wind Sensor, NMEA2000 Interface & Mast Cable Pack
RRP: $939.00
NOW: $933.00
-
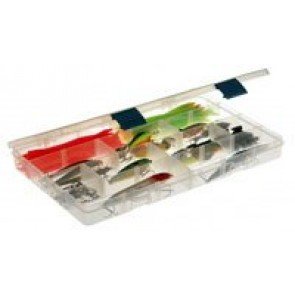
Plano Stoway Tackle Boxes
From: $10.95
-
Berkley Fireline Ultra 8 Braid
From: RRP $34.99
$32.99
-
B&G WS310 Replacement Wired Wind Sensor
RRP: $769.00
NOW: $764.50
-
B&G WS320 Replacement Wireless Wind Sensor
RRP: $899.00
NOW: $893.50